Designing a Reverse Proxy -- Why Golang performs better than Java(Spring Boot), An In-Depth Analysis
First published on: Medium
Reverse Proxy
In micro-service, Reverse Proxy is a popular term. Let’s describe a Reverse Proxy with the following picture:
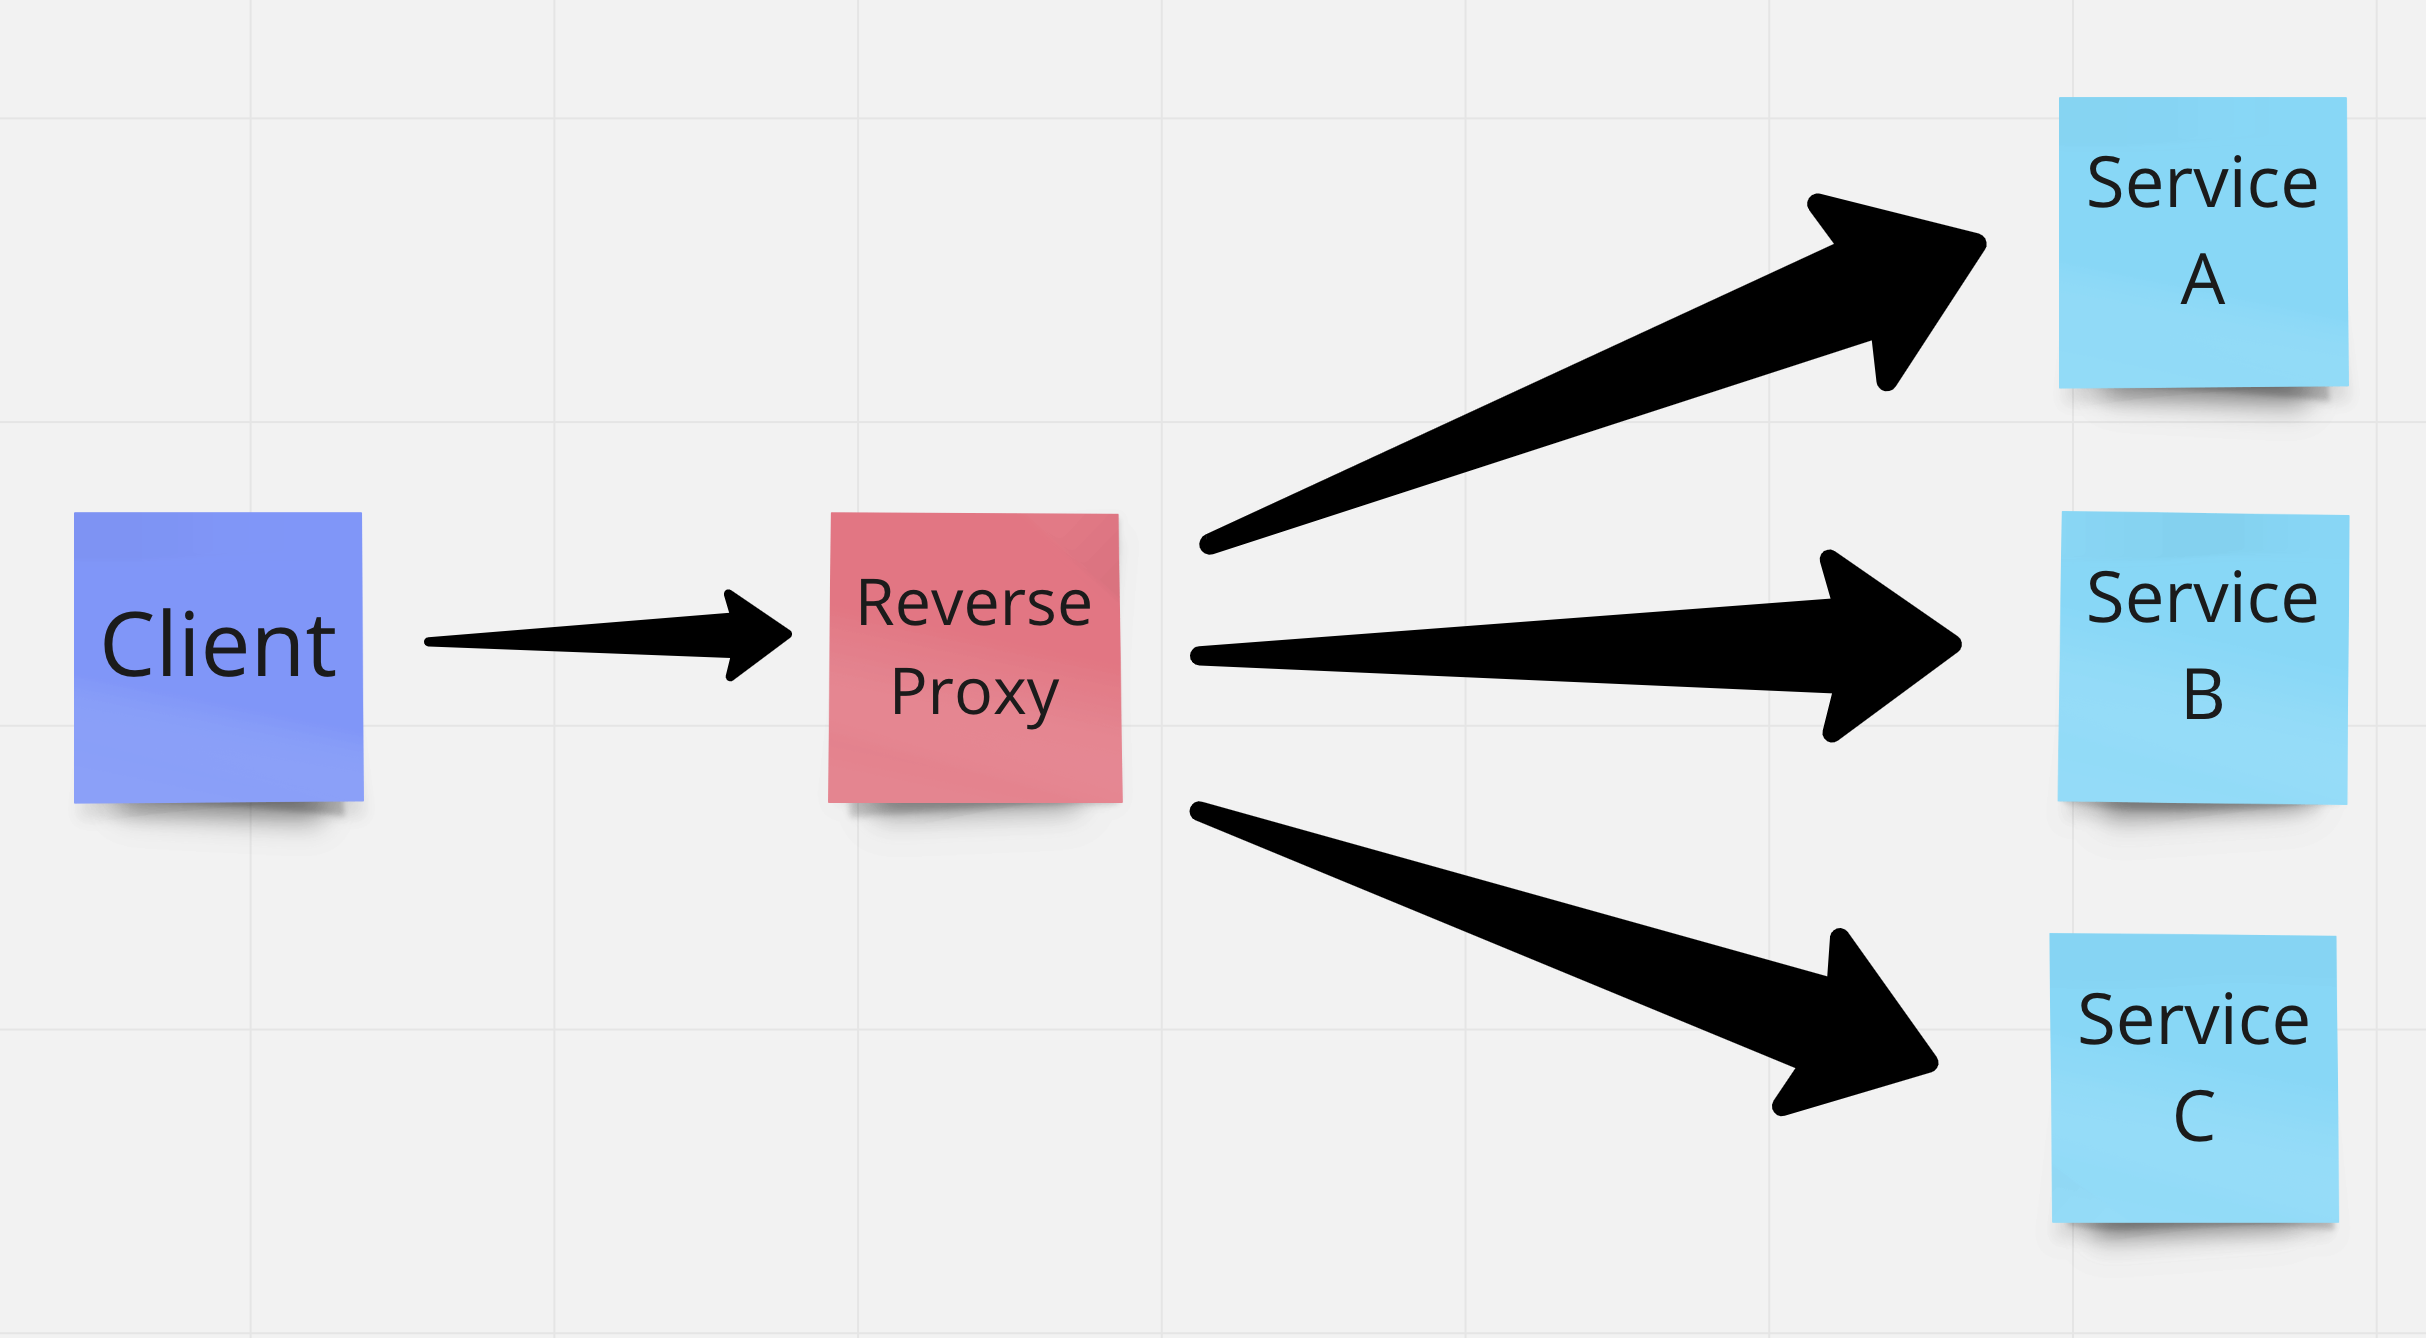
Say, you have multiple services that can have different types of functionality. To consume those functionalities, your website or mobile application needs to know the domain path (the API endpoints) of those services. But rather than giving the client this responsibility, you can abstract this logic.
So, you can have a separate service and your client can connect to this server. Now based on your request, this server will redirect the requests to the corresponding services. Therefore, this separate service is called the Reverse Proxy.
Example
Say you have three separate services and they are:
mycart.mycoolapp.commypayment.mycoolapp.commycoolproducts.mycoolapp.com
And your client consumes these three features. So, you can create a Reverse Proxy. Your client can connect to this reverse proxy, say, mycool-reverse-proxy.com.
Now, say, your client wants to get the list of all the cool products. So, it requests the proxy mycool-reverse-proxy.com/products. And now the proxy can see that in the API path you are requesting for product service. So it redirects this request to the Product service.
The whole point of Reverse Proxy is to abstract your backend logic. So the client does not need to know how many services you have or their addresses or where they are.
Cool, isn’t it? Yep!
Now, look at the above image again. What is Reverse Proxy doing here? It is sitting between your clients and your services and routing the requests.
You may think that reverse proxy is a load balancer. But it is not. They have completely different types of responsibilities and they mean different things.
Now, let’s do quick math!
Say, the clients will call Service A 10 requests, Service B 20 times, Service C 5 times. But as the Reverse Proxy is sitting between the clients and the services, all the requests will go through it, won’t they?
Yes of course. All the 35 requests will go through it. Now as your business grows, you get more load. So you scale your services. But as we saw, the reverse proxy experience a total load of all the services. So, you’ll do horizontal/vertical scaling. You add more machines.
So, while developing the reverse proxy, you’ll be choosing a language, say Java, Node, Golang, etc. Does this language have any effect on the reverse proxy, or is there any performance variation among those languages in the reverse proxy? Let’s find out.
In this article I will only focus on analyzing the performance of a reverse proxy in Spring Boot (which is a Java-based framework) vs Golang.
What is a thread
A thread is a place where information is executed in a serial order. Threads are executed in the processor. If you have one core and you have many threads, those threads will get executed one by one. Say, you have 3 threads A, B, C. Then in the single-core, A will get executed then B then C. But they will not get executed in parallel. But while executing the threads they will not get executed sequentially. So it will not happen that A will be executed fully then B will be executed fully then C will be executed fully.
What will happen some instructions of A will get executed then the OS will pause executing thread A and will start executing thread B. After executing some instructions of B the OS may resume executing thread A or start executing thread C. Which thread will be executed is controlled by a scheduler managed by the OS.
This is called context switching. But while a thread is paused and another thread starts executing, how can we come back to the first thread and start executing where we left?
Well, here comes the two things that made it possible.
- An instruction pointer that knows which line was last executed
- A Stack that contains local variables as well as pointers to heap-allocated variables.
With this information, the scheduler can easily pause a thread and run other threads and starts executing the thread from where it was paused.
Java thread
Java is a JVM based language. And when you create a thread in Java, JVM maps this thread to the OS level thread. Your Java thread and OS thread is basically 1:1 mapping. The OS-level thread has a fixed-size of the stack. It cannot grow infinitely. In a 64 bit machine the size is 1 MB. So if your memory is 1 GB you can have approximately 1000 threads. And as JVM maps the thread to the OS-level thread in a 1:1 mapping, so you can create approximately 1000 threads with a JVM-based language say in Java. So a Java thread is heavy, has a fixed stack size and you can have around 1K thread in 1 GB of memory.
What is a Goroutine
A goroutine is a lightweight thread managed by the Go runtime. It’s a bit different than the Java thread we saw earlier. The Goroutine scheduler schedules goroutine for execution. But the fun fact is Goroutines are not 1:1 mapped with the OS-level thread. Multiple Goroutines are mapped into one single OS thread. So it’s multiplexed to the OS thread. And another interesting fact about the Goroutine is Go has no fixed-sized stack. Rather it can grow or shrink based on the data. So Goroutine utilizes this feature. On average the default size of a stack of a new Goroutine is around 2 KB and it can grow or shrink as needed. So, in a 1 GB of memory, you can have 1024 * 1024 / 2 = 5,24,288 this many numbers if Goroutines.
Context Switching comparison for Java and Golang
As described above, JVM uses OS-level threads. So when threads execute the OS-level scheduler schedule, execute the thread. So the context switching happens at the OS-level. When the kernel makes the context switching it has to do a good amount of work. As a result, it takes some time (microseconds level) when the context switch happens.
On the other hand, Golang has its own Goroutine scheduler specially and optimally built for this task. The Goroutine scheduler map Goroutine to an OS-level thread and Process in the core. And it’s optimal for context switching to takes less time to do so.
Performance comparison of Golang and Java(Spring Boot) in a Reverse Proxy
So, after discussing all of the theoretical things it comes to this point. As Spring boot is run in a Tomcat server, each request is handled by a separate thread. So, when a request comes a thread is allocated to process this request. And as it’s using JVM underneath we saw that these threads are OS-level threads.
On the other hand, if you use Goroutine to serve each request, i.e. when a request comes you allocate a Goroutine to handle the request it will perform better than Spring boot. Because we already saw that Goroutine has certain advantages over the thread in the previous paragraph.
And we also saw, that in a 1GB RAM, there will be more Goroutine than thread (5,24,288 vs 1000). So you can handle more requests with a Golang service.
As a reverse proxy usually will experience all the loads of your system, so there will always be a high amount of requests there. And if you handle it with lightweight Goroutine, you can use all the pros of Goroutines to gain a high throughput and better performance and concurrently serve more requests.
Cos of Goroutines
With great power comes great responsibilities.
Though there are a good amount of positive sides in Goroutines there are some cons. In Spring boot there will be a fixed amount of thread pool. So, when a request comes, a thread is taken from the pool, and when the work is finished the thread is kept in the pool again. It’s handled by the Tomcat server.
Whereas, it’s not handled automatically in Golang world. So, either you designed the transport layer with the famous Golang’s net/http package or use some framework like Gin-gonic there is no Goroutine pool by default. So, you’ll have to manually handle it.
But you may be wondering why do I need to have a pool? Here’s why?
When your code is deployed, there’ll always be an OS be it in a server or in Kubernetes Pods. And an OS has a term called ulimit. ulimit is a file descriptor and an indicator to access the i/o resource. When we make a network request from our code the outside world, a TCP connection is opened and then after the handshaking, the request is made. And ulimit denotes how many file descriptors can be in the OS which is responsible for making TCP connections. The more ulimit you have the more TCP connection you can create.
A Linux OS has the value of ulimit around 2^16 = 65,536. In the Mac system, the default value is 252. But you can always increase it ulimit -n number_of_ulimit_you_want.
And this is one of the failure points in Goroutine.
What happens in a Reverse proxy? We saw that a request comes to the proxy and then based on the request, the reverse proxy redirects the request to any downstream service. And to do that, the reverse proxy makes an outbound request from itself. And to make an outbound request a TCP connection is required which is basically a network I/O. And file descriptors handle it. And ulimit denotes how many file descriptors the OS can have.
You can spin up almost 5,24,288 number of Goroutine in a 1GB RAM. Now in a reverse proxy, if you implement it with Golang and you do not have any Goroutine pool, what will happen is, you can receive a huge amount of requests and your server will not bog down. But as the reverse proxy will redirect the request to all the different downstream, so it will make all the outbound requests. As a result, so many TCP connections will open, and all of them are network I/O. So the file descriptors will handle all of them. So if the number of outbound requests to your other service exceeds the number of ulimit you have, then you’ll get too many open files error.
So, that’s why you should have a Goroutine pool based on the ulimit you have so that you don’t fall into the above error.
Practical comparison
So… I did an experiment by having a product service written in Spring boot. Then I have developed two reverse proxies. One is written in Spring boot and the other is written in Golang (I used Gin-gonic for the router). Then I used JMeter to load test the whole system. Here is the result.
| Number of Requests | Standard Deviation (Spring Boot - Golang) | Throughput req/sec (Spring Boot - Golang) | Avg (Spring Boot - Golang) | Min (Spring Boot - Golang) | Max (Spring Boot - Golang) | Received KB/sec (Spring Boot - Golang) | Avg Bytes (Spring Boot - Golang) | Notes |
|---|---|---|---|---|---|---|---|---|
| 10000 | 4.14 — 2.70 | 100.77801 — 101.02337 | 2 — 0 | 1 — 0 | 208 — 150 | 95.14 — 88.99 | 966.7 — 902.0 | Ramp up period 100s |
| 20000 | 7.82 — 2.79 | 100.36483 — 100.47373 | 3 — 0 | 1 — 0 | 342 — 125 | 94.75 — 88.50 | 966.7 — 902.0 | Ramp up period 100s |
| 30000 | 5.85 — 2.34 | 299.98200 — 301.09599 | 3 — 0 | 1 — 0 | 275 — 119 | 283.20 — 265.22 | 966.7 — 902.0 | Ramp up period 100s |
| 30000 | 14.20 — 3.19 | 150.07654 — 150.38348 | 5 — 0 | 1 — 0 | 495 — 125 | 141.68 — 88.50 | 966.7 — 902.0 | Ramp up period 200s |
| 30000 | 5.00 — 2.89 | 100.26671 — 100.31834 | 2 — 0 | 0 — 0 | 245 — 121 | 94.66 — 88.37 | 966.7 — 902.0 | Ramp up period 300s |
| 80000 | 11.63 — 3.49 | 199.98850 — 200.20772 | 4 — 0 | 1 — 0 | 497 — 168 | 188.8 — 176.35 | 966.7 — 902.0 | Ramp up period 100s |
The definition of this matrix is as below: Number of Requests is the number of samples with the same label. Average is the average time of a set of results. Min is the shortest time for the samples with the same label. Max is the longest time for the samples with the same label Throughput is measured in requests per second/minute/hour. The time unit is chosen so that the displayed rate is at least 1.0. When the throughput is saved to a CSV file, it is expressed in requests/second, i.e. 30.0 requests/minute is saved as 0.5. Received KB/sec is throughput measured in Kilobytes per second. Time is in milliseconds. Standard Deviation is - a measure of the variability of a data set. JMeter calculates population standard deviation (STDEVP function analog) Avg Bytes - arithmetic means of response bytes for the samples with the same label.
As you can see from the above matrix Golang performs better than the Spring Boot. The Standard Deviation is denoting that the Spring Boot system is deviating a lot.
Let’s look at the CPU and memory usage of the Golang proxy and Spring Boot proxy.
In my hexacore machine, I ran the product service written in Spring boot. Then first I launched the spring boot proxy and then took the matrix. After that, I ran the Go proxy and took the matrix. They are as follows:
| Proxy type | % CPU | Number of OS threads | Memory (MB) |
|---|---|---|---|
| Spring Boot proxy | 7.2 | 46 | 124.2 |
| Go Proxy | 0.1 | 26 | 7.8 |
So… Golang really used less CPU and Memory compared to the Spring boot proxy. And based on the previous theoretical discussion this is expected.
So, it can be said that when a proxy will be deployed in the server, in terms of resources like CPU and memory, Golang performs better than the Spring Boot. So in the case of scaling, like horizontal scaling, it will take more Spring boot proxy to cater huge amount of load. Whereas it will take less Go proxy because the auto-scaling group usually monitors the CPU and memory usages of the instances when it comes to the scaling.
So, that’s it for today. Hope you enjoyed it.
See you in another article. Till then enjoy life.
Reference
- https://tpaschalis.github.io/goroutines-size/
- https://codeburst.io/why-goroutines-are-not-lightweight-threads-7c460c1f155f 3.https://docs.google.com/document/d/1TTj4T2JO42uD5ID9e89oa0sLKhJYD0Y_kqxDv3I3XMw/edit#heading=h.mmq8lm48qfcw